
by Jakleen Al-Dalal’a
For someone checking a storm overflow map before a swim, the question may seem straightforward: is it safe to enter the water? In our online workshop, participants questioned what a “safe” label would mean for people swimming, paddling or working beside a river. Their discussion raised a further question about the advice a map might offer: what would readers need to know before deciding whether it applied to their own activity and circumstances?
On 7 October 2026, twelve participants joined an online Spilling the Truth workshop led by Dr Jakleen Al Dalal’a, with support from Dr Yaqian Wu and Dr Artemis Skarlatidou. Participants brought experiences of swimming, river and coastal monitoring, and reporting suspected pollution. Spilling the Truth is a series of participatory workshops exploring how public maps communicate storm overflow releases and how people interpret and use that information. It forms part of CHRYSES, a research project examining how environmental health crises are understood and communicated. The workshops invite people who use, monitor and care for rivers to identify questions that existing maps leave unanswered and develop proposals for how those questions could be addressed.
Using Miro, a shared online workspace, participants discussed existing storm overflow maps, recorded the questions they wanted the maps to answer and developed proposals around a River Lea basemap. Their discussions examined how people interpreted recorded releases and what evidence would support any advice about using the water. Participants also questioned which activities and circumstances that advice would cover and who would take responsibility for it.
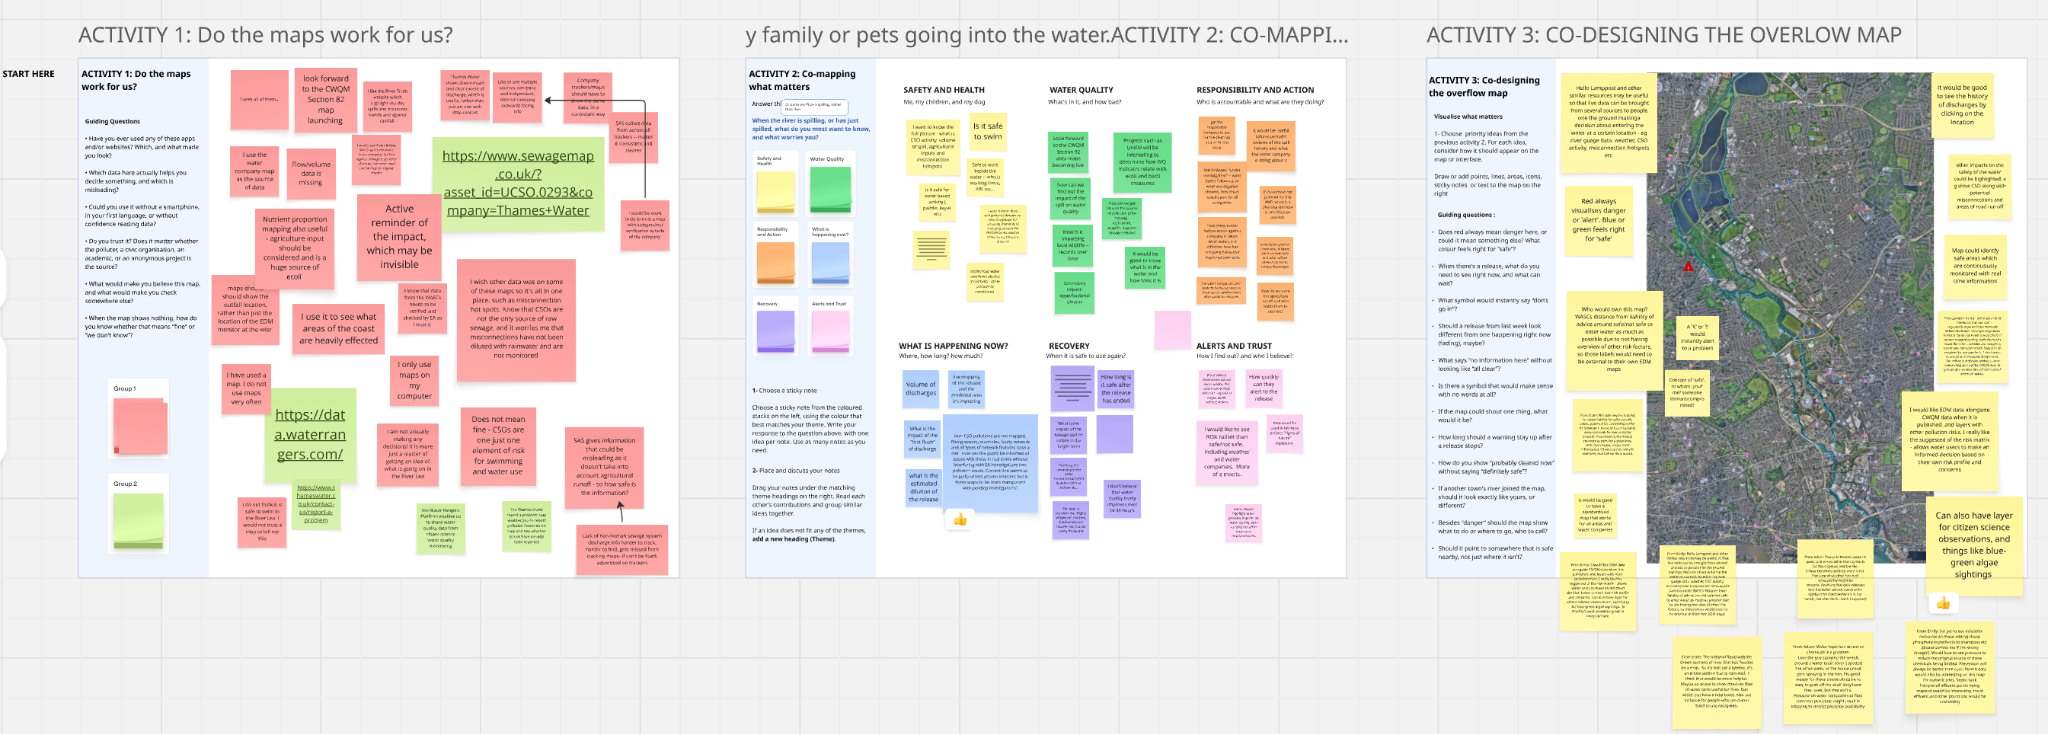
Fig 1. The shared Miro board from the online Spilling the Truth workshop, capturing participants’ questions and ideas for rethinking storm overflow maps.
Understanding the data behind the map
Participants discussed what storm overflow maps could tell people planning to swim or paddle, or working beside a river. One swimmer valued Surfers Against Sewage’s map because it brought information from different water company areas together. When deciding where to travel for a swim, they could consider several locations through one map rather than consult individual company websites. Participants also discussed what made them willing to rely on that information. “I trust my water company’s website, because that’s where the data comes from,” one participant explained. For this participant, knowing the originating source was a reason for confidence. Others noted that maps published by different organisations could display the same water company records.
These examples distinguish confidence in the source of the records from the usefulness of the way they are presented. For storm overflow maps, this points to a need to explain who supplied the data, whether and how those data have been checked, and how any warnings or advice have been derived from them. Readers would then have a clearer basis for understanding both the evidence behind a display and the conclusions it can support.
Participants also questioned what was absent from the maps. They discussed household wastewater entering rainwater drains through incorrect plumbing connections, one example of pollution that an overflow record would not necessarily capture. Some described smells or visible signs of suspected pollution where maps showed no alert. “I would trust my nose more than anything,” one participant said. The discussion also included clear looking water that people had assumed was unpolluted. These examples help explain why an absence of recorded releases did not necessarily reassure participants, while also showing the limits of relying on what could be seen or smelt to judge the water’s condition.
The point on the map is not the whole river
Questions about what the maps could explain also extended to the releases they did record. Participants wanted to understand what an event at one discharge point could mean for other places along the river. Participants explored this question by asking how much wastewater had been released, which waterways were connected to the discharge point and what could happen farther downstream.
“Where was the actual outfall, rather than the monitor? Which waterways were connected to it? What could happen farther downstream? How much had been released?”
Participants contrasted a small trickle with a large flow to explain why knowing how long a discharge continued did not tell them how much wastewater had entered the river. They also asked how much river water was available to mix with and dilute the discharge.
During the mapping activity, participants proposed coloured river sections and arrows showing direction to connect discharge points with the waterways through which a release might travel. Such a display would need to distinguish a possible route of movement from locations where an effect had been measured. That distinction matters when readers use a map to judge whether to enter the water, leading to questions about what any advice on the map would mean for them.
What would a “safe” label mean?
Understanding which places might be affected by a release still left participants with questions about the advice a map should offer. One participant asked for “RISK rather than safe/not safe”, while another questioned what “safe” would mean for someone with a weakened immune system. Participants also discussed swimming, paddling and working beside water, raising the question of which activities a safety label would cover. These examples challenged the usefulness of a single label without an explanation of the circumstances to which it applied.
One contribution proposed identifying safe areas supported by continuous water quality monitoring, connecting advice about particular places with ongoing measurements of the water there. Another suggested a risk matrix, a structured comparison of risk under different conditions, through which water users could consider their own circumstances. These proposals raised questions about how measurements would be interpreted and used to inform advice. What would a map need to measure before labelling a place safe, and which people and activities would that label cover?
Deciding what a safety label should mean also raised the question of who would be responsible for making that judgement. One contribution asked who would own the proposed map and suggested that safety advice should sit outside water companies’ own maps of recorded releases. Another questioned who would accept responsibility for safety labels. Moving from showing that an overflow has discharged to advising someone about entering the water requires someone to interpret the evidence and decide what advice it can support.
Providing more data and more storm overflow maps can make discharge records easier to access while leaving these questions unanswered. When a map offers advice about using the water, readers need to understand how that advice was reached, which circumstances it covers and who is responsible for it.
Continuing the work together
The findings from Spilling the Truth are informing CHRYSES’s wider work on the design of public maps of storm overflow releases. Bringing the workshops together will help us develop design principles grounded in the questions participants asked and the proposals they explored. The online session contributes examples of how people assess the information behind a map, interpret its warnings and question the circumstances in which its advice would apply.
We plan to stay in touch with participants, share the workshop findings and explain how their questions and proposals are informing our work on storm overflow maps. We would also like to share any design ideas developed from the workshops, so participants can see how their contributions have been taken forward and discuss whether the proposals address the difficulties they identified. These conversations would help shape future activities exploring how different ways of presenting releases, warnings and supporting evidence help people understand storm overflow information.
This work has been supported by CHANSE and HERA CHRYSES, by the Research Council of Finland under Grant Agreement 369388, Research Ireland under Grant Agreement RI4046, by UKRI/AHRC under Grant Agreement UKRI463 and the Estonian Research Council under Grant Agreement 4-8/25/14.


