
by Jakleen Al-Dalal’a
When an overflow map reports that a discharge has stopped, what does that tell someone standing beside the water?
The map may no longer show an active release. It cannot necessarily tell them what was discharged, how much entered the river, where it has travelled, or whether other sources of pollution are present. Yet people may consult that same map before swimming, taking children paddling, or bringing a group of volunteers to the river.
These concerns were at the centre of two further Spilling the Truth workshops. Spilling the Truth is a series of participatory workshops exploring how storm overflow releases are communicated through public maps and how people interpret and use that information. These workshops are part of CHRYSES, a research project examining how environmental health crises are understood and communicated. Working with people who use, monitor and care for rivers, the workshops ask what information they need about a discharge, its possible effects on people and river life, and what happens afterwards. Participants draw on their experiences to identify questions that existing maps leave unanswered and develop proposals for how this information could be represented and communicated.
Following earlier CHRYSES workshops at UCL East, two further sessions took place on 14 and 24 September 2026 at UCL’s Department of Geography, in the North West Wing at Bloomsbury, London, with eight and nine participants respectively. Led by Dr Jakleen Al Dalal’a, with support from Dr Yaqian Wu and Dr Artemis Skarlatidou these sessions brought together citizen scientists, river users, people involved in community groups and river monitoring, and participants involved in the development and provision of publicly accessible storm overflow mapping platforms. In both sessions, participants discussed existing storm overflow maps, recorded the questions they wanted those maps to answer and developed proposals by annotating shared river maps. They examined how warning colours, discharge markers and water quality reading might help explain an event, and what readers might infer from those features when evidence was incomplete.
The workshop at UCL East on 18 July 2026 had raised concerns about whether discharge information helped people understand consequences for their rivers. These two sessions developed that discussion through specific questions about discharge locations, the timing of evidence, the meaning of warning colours and what would establish recovery.
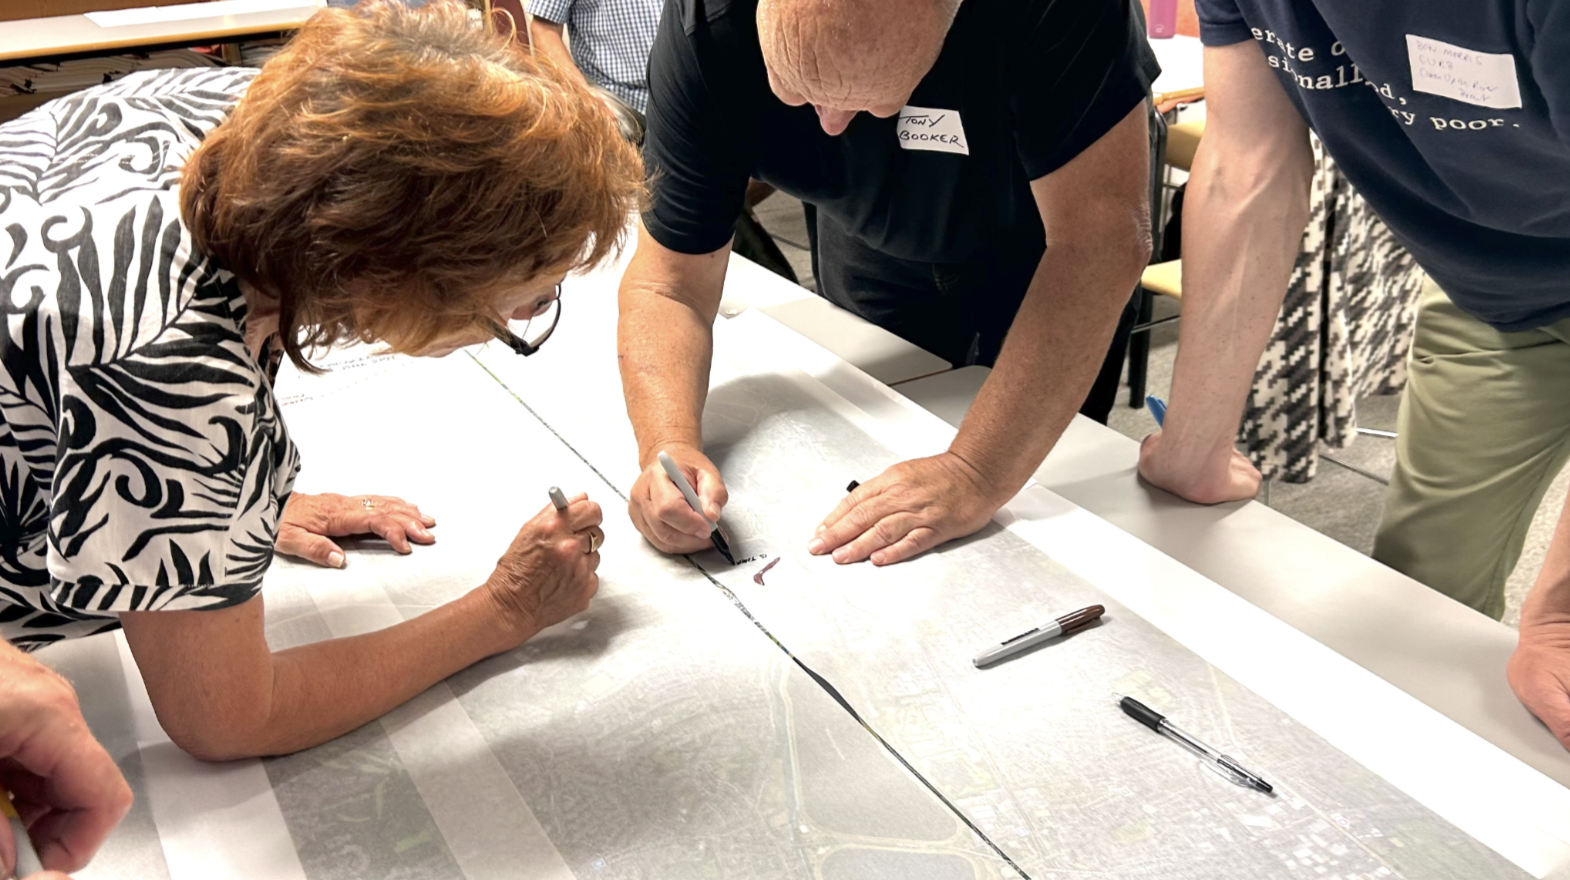
Fig 1. Participants mapping what existing spill alerts leave unclear, including where a discharge enters the river, what may happen downstream, and how long impacts might last. Photo by Yaqian Wu
From discharge points to river conditions
Overflow maps can be useful. Participants described using them to check whether a discharge had been recorded, interpret monitoring results and investigate apparent pollution. But knowing that a discharge had occurred did not tell them what had entered the river, how much had been released or what effects it might have downstream.
“It’s telling you it’s discharging, but what? How much?” one participant asked.
During the discussion on 24 September, participants also distinguished between the location of a monitor or sewer asset and the outfall, the outlet through which a discharge enters the river. They described uncertainty about the drainage connections between the two, meaning that an accurately positioned marker could still leave someone investigating pollution unclear about where the release reached the water. Their mapping proposals therefore included identifying outfalls and their sources together with measurements upstream and downstream, allowing a recorded discharge to be considered in relation to observations of the river itself.
This concern with understanding what enters the river extended beyond monitored overflows. Participants discussed misconnections, where wastewater from toilets or household appliances is incorrectly directed into drains intended to carry rainwater, alongside road runoff carrying contaminants and treated effluent, the wastewater released after treatment at a sewage works. These other inputs mattered because an overflow map could accurately display recorded releases while leaving other possible sources of pollution unrepresented. Participants wanted to see overflow releases alongside those sources, helping them build a fuller picture of what might be affecting their river and understand an individual discharge within that wider context.
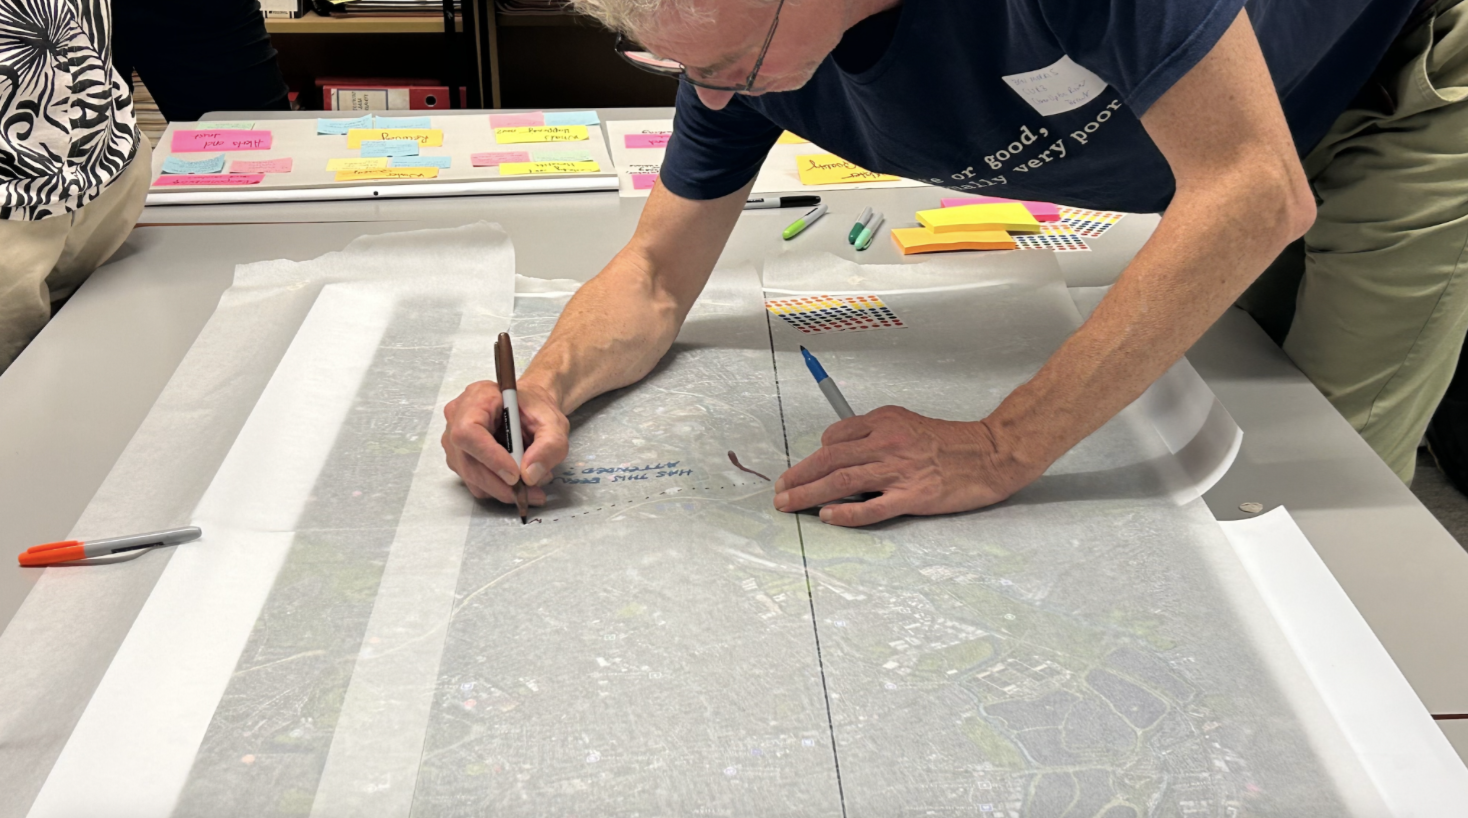
Fig 2. A participant traces how a discharge may move downstream, asking what a map can show about its path, impacts and uncertainty. Photo by Yaqian Wu
What happens after a discharge ends?
The distinction between a recorded discharge and the river’s condition became particularly difficult after an event ended. On 14 September participants debated whether a coloured warning should move downstream with the river, fade over time, or change from red to amber to green. As they explored these options, participants asked what evidence would justify them. How far had the discharge travelled? What had been measured along the way? If a symbol turned green, would someone understand it as “the discharge has stopped”—or “the river is safe”?
Participants differed over downstream colouring. Some valued a display showing which downstream stretches might be affected by a release. Another participant used the Thames as an example, questioning how an upstream event could make a long stretch appear affected when the volume released and conditions downstream were unknown. The discussion exposed a difficulty within the proposed design itself. A coloured line could communicate a possible route of pollution while also suggesting that its effects had been established throughout that stretch. Participants explored a clock symbol to show how long ago a discharge had occurred, although elapsed time alone would not establish whether the river had recovered. This also explains why participants questioned using green when readers might understand it as a signal that the water was safe.
Participants’ questions about recovery help explain their concern about what a change of colour might suggest. Across both workshops, they asked how long the effects of a discharge might last and how recovery would be assessed. One question recorded during the activities made this explicit: “What monitoring is required to measure recovery?” Their questions concerned both water quality and river life, with requests on 24 September for dissolved oxygen readings 100 metres downstream and information about lasting effects on fish and invertebrates. They also asked about responses to pollution, including aeration, which adds oxygen to the water, and clean up measures. Understanding what happened after a discharge therefore involved questions about changes in the river and what action might support its recovery.
Their map proposals reflected this interest in understanding an event over time, linking a discharge with conditions beforehand, observations afterwards and earlier occurrences at the same location. Interpreting that information, however, also required clarity about gaps in the available evidence. An offline monitor or an unavailable reading could not be treated as equivalent to a record showing no discharge. Participants wanted maps to distinguish these situations, so that an unexplained status or missing information would not be mistaken for reassurance about the river.
Even when measurements were available, readers needed to know when the water had been sampled. On 14 September, participants described citizen science samples whose laboratory results appeared online around five days after collection. These results could help document earlier conditions and reveal patterns over time, but they described the water when it was sampled, rather than when the results appeared online. Participants therefore wanted maps to identify the source of the evidence and when it had been collected, making clear which period it described and why it could not necessarily answer questions about the river’s current condition.
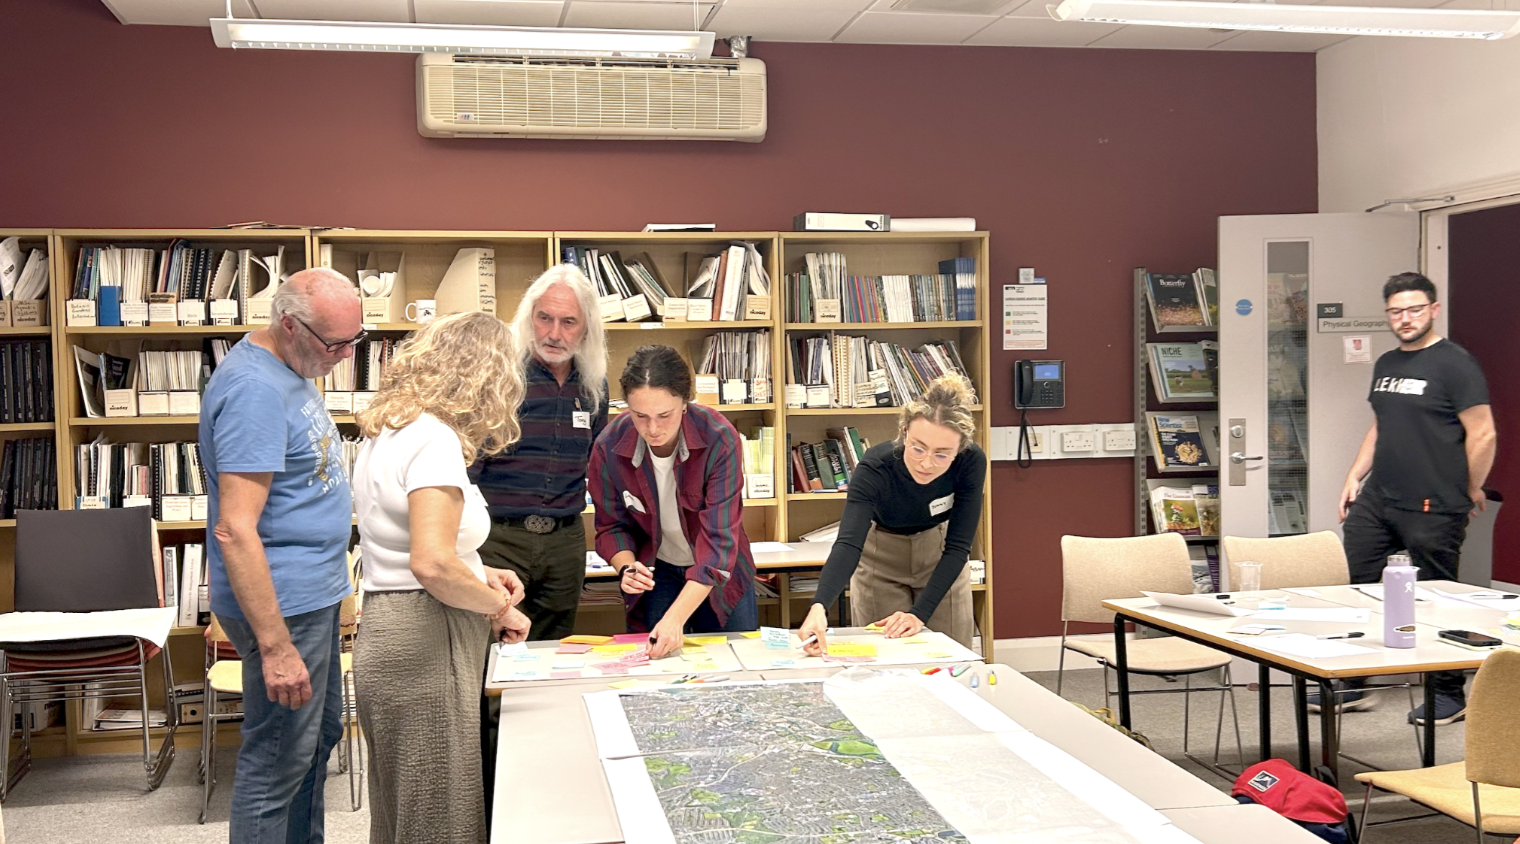
Fig 3. Participants working together to identify the questions that existing storm-overflow maps leave unanswered, before translating them into possible map features. Photo by Yaqian Wu.
More than a better dashboard
The mapping activities produced proposals for connecting discharge locations with upstream and downstream observations, distinguishing missing readings from recorded inactivity, and showing when water samples had been collected. Participants also questioned what evidence would justify a warning moving downstream, fading or changing colour. Their proposals identified information that maps could explain more clearly, alongside questions about downstream effects and recovery that would require further measurements.
The question left by these workshops is therefore a practical one. When a map tells someone that a spill has ended, what else do they need to know before they can understand what happened to the river?
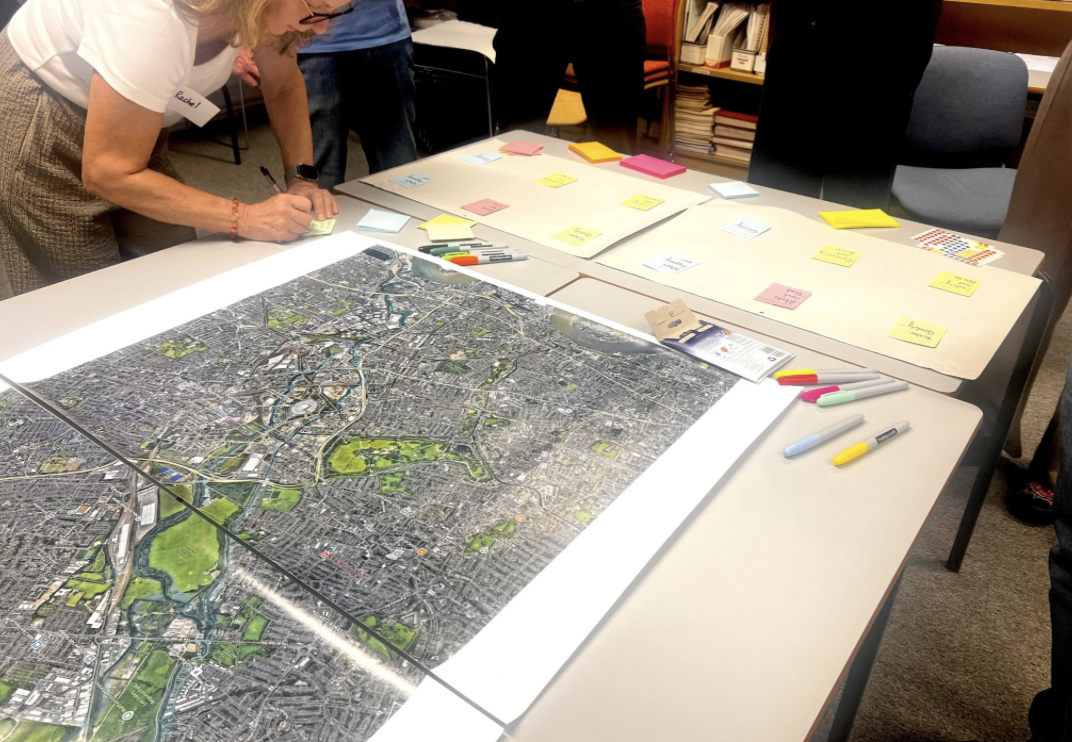
Fig 4. Participants identify the questions and information that matter most when interpreting storm-overflow events, using a shared river map and themed boards. Photo by Yaqian Wu.
This work has been supported by CHANSE and HERA CHRYSES, by the Research Council of Finland under Grant Agreement 369388, Research Ireland under Grant Agreement RI4046, by UKRI/AHRC under Grant Agreement UKRI463 and the Estonian Research Council under Grant Agreement 4-8/25/14.


