
by Jakleen Al-Dalal’a and Artemis Skarlatidou
When a combined sewer overflow releases sewage into a river, how do people actually find out, and do they trust what they are being told?
On 18 July 2026, residents, river users, and representatives from local organisations and community groups met at UCL East to work through that question together. The session is part of CHRYSES Project, a European research collaboration examining how environmental health crises are understood, remembered and communicated. It forms part of a growing series of workshops and events exploring these questions across different rivers and communities and following on from an earlier session in which participants mapped what crisis along the River Lea actually looks and feels like, drawing on memory, routine and everyday use of the river rather than official and formal data. Across both sessions, a consistent concern has been how lived experience and public data meet – or fail to meet – when people try to understand what is happening to the rivers they care about.
Led by Dr Jakleen Al‑Dalal’a and Dr Artemis Skarlatidou (UCL Geography), with support from Zenith Xue (UCLIC) the workshop turned to a question that had surfaced repeatedly during earlier discussions: how are storm overflow discharges communicated to the public, and do existing maps help people understand what they need to know? Rather than treating participants as users of existing environmental information, the workshop invited them to become co-designers of new ways of communicating this information. The session also brought together people connected to rivers well beyond the Lea, reflecting similar concerns across different catchments and communities.
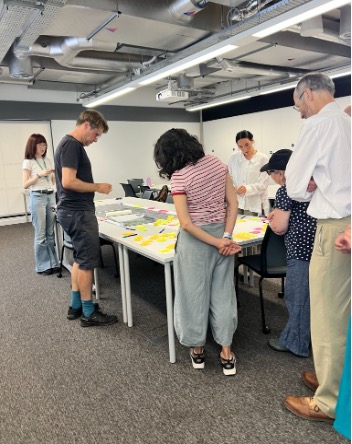
Participants discussing what they most need to know when the River Lea is spilling, before starting the mapping exercise. Photo by Jakleen Al-Dalal’a.
A lot of data, not much trust
There is more publicly available information on river pollution than there has ever been, spanning government platforms, water company dashboards, campaign apps and independent citizen science projects. Recent coverage, including Channel 4’s documentary Dirty Business on Britain’s sewage scandal, has pushed these issues into national view. This workshop focused on what that looks like for people trying to rely on discharge maps in everyday life. According to Environment Agency data, storm overflows released rainwater with untreated sewage into England’s rivers and seas close to 300,000 times in 2025, for a combined 1.9 million hours. Thames Water, which covers the River Lea catchment, recorded 107,000 hours of sewage discharge that year. Campaigners and organisations such as the Rivers Trust and Natural World Fund have argued that many of these releases are likely happening outside permitted conditions, rather than only when storms genuinely overwhelm the system, drawing on detailed analysis of recent Event Duration Monitoring data. Yet official monitoring records how often and for how long a spill lasts, but not how much untreated sewage was actually released together with rainwater, a gap that mirrors exactly what participants raised about the maps they use.
Despite this growing volume of information, participants questioned whether existing storm overflow information systems actually help people understand environmental conditions and make informed decisions. Rather than asking whether monitoring exists, the discussion quickly shifted towards a more practical question: does the information answer what people need to know? Much of today’s environmental information infrastructure has been developed to satisfy regulatory reporting and operational monitoring requirements, leaving members of the public to bridge the gap between technical data and everyday decisions such as whether it is safe to swim, paddle, fish or simply spend time by the river.
Workshop participants spent part of the session comparing several storm overflow release information systems side by side. Rather than debating which interface looked better, they quickly returned to a more fundamental question: would any of these maps help someone decide whether it was safe to enter the water or spend time by the river? Most participants said they had come across these tools before but had rarely, if ever, used one to answer a real question about their own stretch of river. As one of the participants put it:
“It’s not that I don’t trust the actual numbers. It’s just that I don’t trust the conclusions I’m supposed to make. It’s the gaps between the data”.
That quote captured one of the workshop’s central insights. Participants were not questioning whether sensors had detected a discharge or whether monitoring data existed (although we are aware that this is also a significant public concern). Instead, they questioned whether the information communicated the practical meaning of those measurements. Knowing that a spill had occurred was not the same as knowing whether it was safe to enter the water, how conditions might change downstream, or when the river might recover. The challenge was therefore not simply making environmental data available, but making it meaningful for everyday decision-making.
A few frustrations came up repeatedly. Participants noted that most existing storm overflow maps communicate pollution as a discrete event occurring at a single location. Rivers, however, do not behave this way. Participants repeatedly pointed out that rivers are dynamic systems, whereas most storm overflow maps communicate pollution as though it were fixed to a single location. Water, pollutants and associated risks move downstream, disperse and change over time, yet these processes are rarely represented transparently. Most platforms indicate where a discharge occurred, but provide little or mostly no indication of where its effects may travel or how conditions evolve after the event. Participants also noted that duration and volume are rarely presented together or placed in context, making it difficult to judge the likely risk of a discharge.
For some participants, the bigger issue was not the maps themselves but who they are really for; people trying to make sense of their rivers, or the institutions that produce and regulate the data.
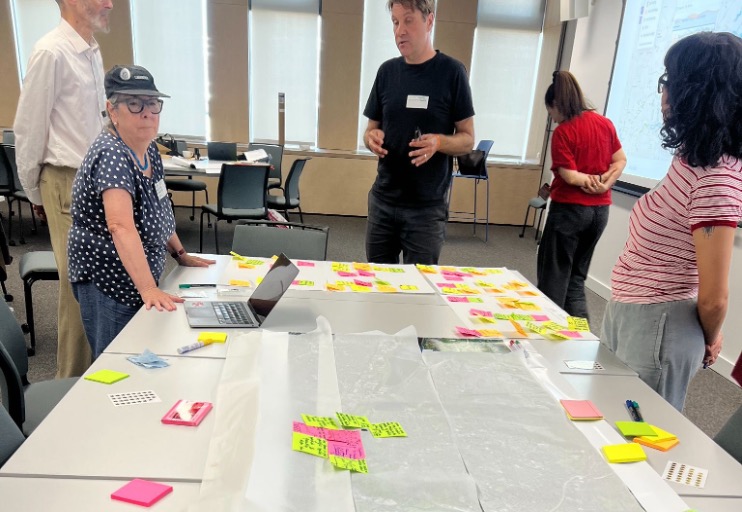
Co‑designed (what matters) boards, where participants clustered questions and concerns about storm overflows around a shared map of the River Lea. Photo by Jakleen Al-Dalal’a.
What people actually want to know
The workshop moved into a shared mapping exercise, where everyone worked together around one table to surface what actually matters to them when a river is spilling, or has just spilled. People wrote down their questions and concerns and clustered them, building up a picture of what counts as urgent information when the water changes.
When participants started discussing the questions they would actually ask when visiting a river, one concern consistently sat at the centre of the discussion “Is it safe to enter the water?” . Around this seemingly simple question emerged a much broader set of concerns relating to health, water quality, accountability, environmental recovery and ecological impacts. Alongside these, they stressed the costs of pollution for local livelihoods, the impact on species and habitats over time, and the everyday ways they recognise that something is wrong with the water – smell, colour, the feel of the river. Participants wanted to know not only who is accountable and what is being done, but also how spills affect food, pets and bodies, whether incidents are isolated or part of a pattern, and how far their effects travel downstream.
Interestingly, relatively few questions focused on the discharge event itself. Instead, participants wanted information that explained its consequences. How long before the river recovers? How far downstream are impacts felt? Which wildlife is affected? Is this part of a recurring pattern? For participants, the value of reporting a discharge lay in helping them understand what that event meant for the river and for the decisions they needed to make, rather than presenting it as an isolated piece of technical information.
For the people living with this, safety was never a single, clean question. It touches health, money, nature and trust all at once, and any tool trying to communicate crisis has to hold all of that together.
Building the map people actually want
In the final part of the session, the participants took everything that had come up and used it to redesign the map itself, sketching new layers, symbols and a shared legend.
What emerged was not simply a redesigned map but a different vision of what environmental information should do. Rather than focusing on reporting storm overflow releases, participants imagined an interface that helps people understand changing environmental conditions and make informed decisions about the rivers they use.
Rather than a single flat warning, people imagined something layered, combining pollution readings with wildlife data, local investment, weather and a way for residents to add their own reports directly onto the map. Nature featured heavily, with proposals to track species and habitat change over time, not just log a single incident. Most importantly, participants wanted official monitoring to sit alongside citizen science observations and local knowledge, treating these as complementary sources of evidence rather than competing forms of expertise. Rather than expecting people to interpret dense data alone, participants built guidance into the design – prompts, explanations and visual cues – so that different users could find the information that speaks to their own concerns.
What’s next
This workshop is one part of a larger body of work looking at how the public relates to environmental data, and how much of what currently exists is built for compliance rather than genuine public use. The team is now looking to grow this work further, creating an ongoing space for these conversations to continue with communities beyond the Lea, and exploring whether data collected by residents themselves could sit alongside official monitoring to see how the two compare. Forthcoming research will draw directly on these workshops to examine storm overflow platforms and to propose design principles based on what communities identify as necessary to understand and respond to storm overflow discharges.
As environmental crises become increasingly persistent rather than exceptional, understanding how environmental information is communicated may be becoming just as important as the environmental data themselves. Designing interfaces that simply report pollution events is no longer enough. Public-facing environmental information also needs to support interpretation, helping people understand what the available evidence means, how conditions may change, and what actions they can safely take.
What this session made clear is that people don’t need to be experts to know exactly what’s missing from the tools that are meant to disclose environmental information. Given the space, the materials and their own knowledge of the places they care about, they were able to imagine a map that better reflects how people actually live with and feel their rivers.
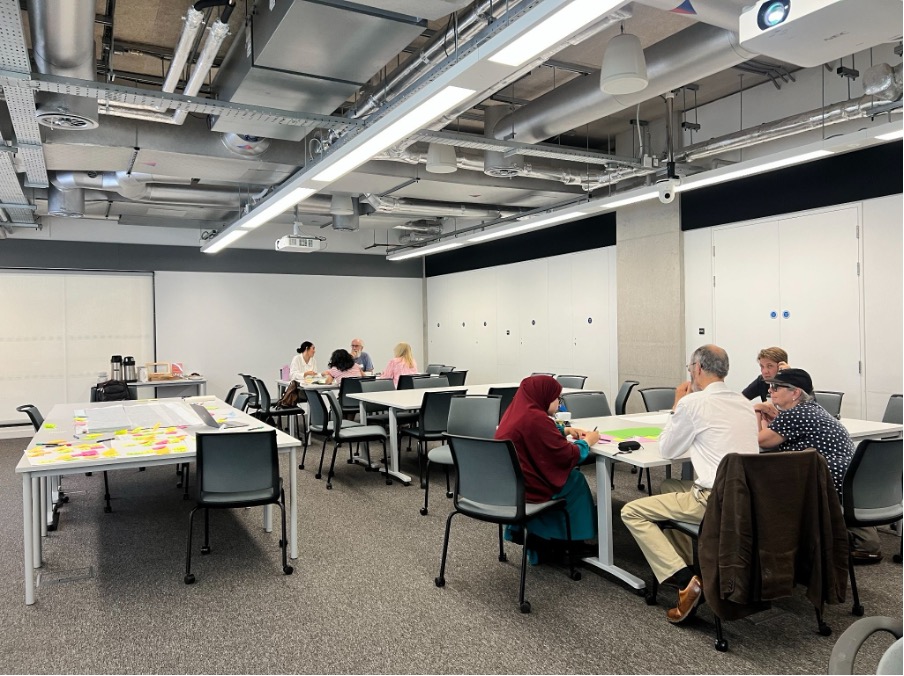
Participants at UCL East working in small groups to redesign storm overflow crisis maps during the CHRYSES workshop. Photo by Jakleen Al-Dalal’a
This work has been supported by CHANSE and HERA CHRYSES, by the Research Council of Finland under Grant Agreement 369388, Research Ireland under Grant Agreement RI4046, by UKRI/AHRC under Grant Agreement UKRI463 and the Estonian Research Council under Grant Agreement 4-8/25/14.


