
This blogpost is the second part of the blogpost Crisis Mapping By Affected Agro-Pastoralists in 🇪🇹 Ethiopia: Crowdsourcing for Food Security? Here, the system and the proposed data-driven collaboration framework between participants with similar and different backgrounds, realities and land related geographic knowledge are described.
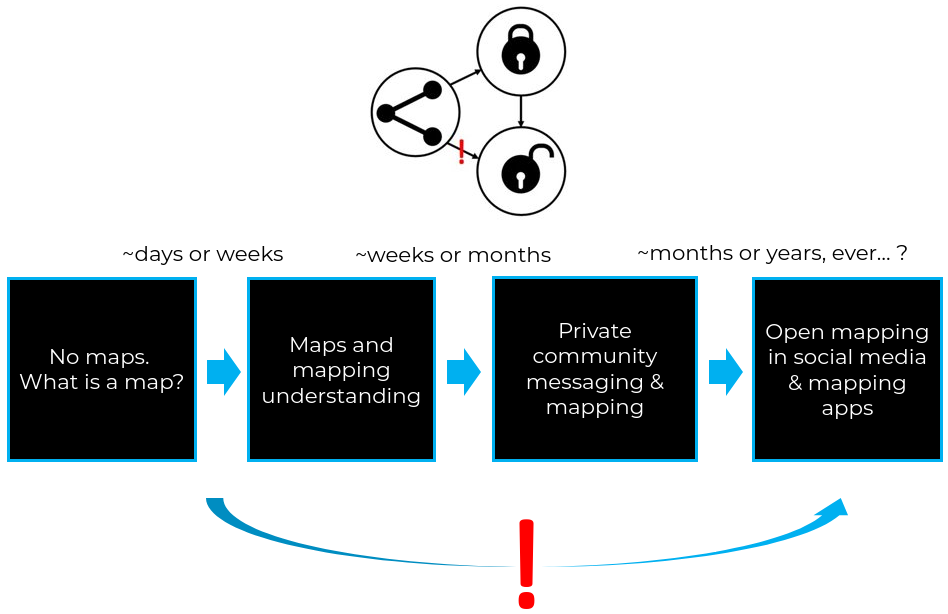
This framework is based on two main linked assumptions. The first is that to democratise the production and use of geographic information, Geospatial and Information and Communication Technologies (geo-ICTs) need to take into account which technologies lay people (will) use, and adapt geo-ICTs to such technologies, not the other way around (Figure 1). Generally speaking, lay people tend to use only a fraction of the mapping functionalities of ‘mapping’ (navigation) apps, never mind Earth Observation (EO) data browsers.

The second assumption is that, though multi-stakeholder collaboration should be multi-directional, open land user-generated land use data is a process that must follow its own pace. Lay people should first understand the concept of maps, private mapping and open mapping before sharing their knowledge about their land as open data. Jumping steps brings with it risks of harm to local people, especially the most vulnerable (Figure 2).
The framework has two broader components, as represented in figure 3, which is provided to help situating the elements in figure 4 and then broken down in figures 5, 6 and 7 for explanation.


Land User-Generated Data
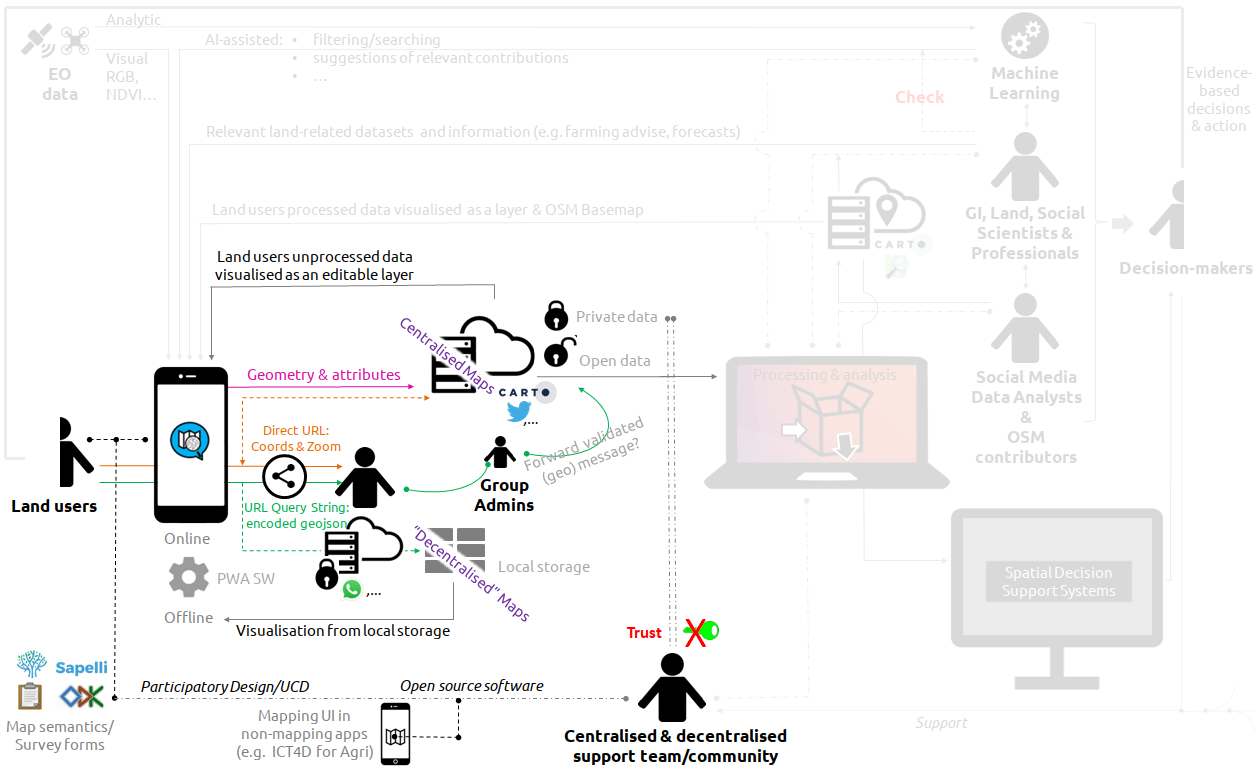
Looking at the diagram above from the land user’s side (left), a land user maps their land using a Sapelli PWA (Progressive Web App) in mobile devices. If they can work online, the land user can share the contribution as open data by sending it to a central spatial or social media database (pink arrow). After the geometry has been sent, any user can re-share this contribution using, e.g., messaging apps (orange arrow). If the land user decides to share the data privately without a custom back-end implementation in place, the contribution is then shared directly using messaging apps (green straight arrow). When the URL with the encoded GeoJSON is opened by other land users, this contribution is automatically stored locally in their devices (‘Decentralised maps’) and is ready for visualisation immediately or later, regardless of connectivity conditions. When the data follows this path, the data is as secure as the security features provided by the messaging app used – Sapelli PWA only provides the front-end technology in this scenario, and Sapelli PWA does not track user interactions.
As represented with the green curved lines, the administrator or any member of the group can then forward relevant or validated contributions using WhatsApp or any other app. The rationale behind the green curved lines is to filter the data that will be shared with other stakeholders (privately or not). Throughout this process, technological complexity can be added incrementally based on the resources available, thus making the system responsive to the local context. For instance, government officials who only have access to mobile devices can filter and forward validated data to officers with GIS skills who can process the data in a PC. Similarly, the support teams or communities (see ‘Support team/community’ at the bottom) must adapt to the resources available in each community to contribute to making participatory mapping accessible and sustainable. In terms of back-end technology, private community mapping using a central spatial database can be an option, but communities and all the stakeholders must be aware that this solution adds technical complexity and it requires more resources and trust in the administrator or support team who will manage the data, unless the data is end-to-end encrypted, which also adds technical complexity and resources. Previous research shows that, in some contexts, and especially at the initial stages of participatory mapping process, using messaging apps alone for private mapping significantly simplifies the implementation process and data ownership-related discussions – those in the (WhatsApp) group decide who gets in and out. In terms of front-end support for creating Sapelli projects or survey forms, previous research shows that the required technical and human resources for converting paper prototypes into digital prototypes are sometimes still missing in some contexts. Do it Yourself (DIY) is still a privilege of few when it comes to customising or developing digital mapping tools, as it requires time and resources (e.g. a PC) to acquire significant technical knowledge, which is likely less relevant than the land-related knowledge that technology is meant to unlock, urgently.
Aiming to address the technical knowledge and resources gap in some contexts, both in terms of back-end (data storage and management) and front-end (UI design and customisation), a workflow for starting a participatory software design and participatory mapping project is proposed and explained below, before finalising the explanation of the collaboration framework diagram and the blogpost.

The community creates the icons/pictures for the map semantics interfaces (step 1), and then uploads the image files and describes how the icons must be organised using a form or an existing template in Sapelli PWA (step 2). This form may also allow to request specific imagery, EO derived datasets etc. (see figure 7). In step 3, the ‘support team/community’ can support, remotely or not, the iterative co-design process, and at the end, very easily customise a Sapelli PWA, create a new subdomain or URL that automatically loads the map semantics interface, and send this new URL to the representative of the community via messaging apps. At this stage, mapping through WhatsApp can start (steps 4 and 5), and only the community has access to the geographic data – the ‘support team/community’ only provides the open-source front-end technology.
Multi-stakeholder collaboration

So far, the land user-generated content component of the diagram represented in blue in figure 3 has been explained. Moving towards the right side of the diagram in figure 7 following the direction of the land user-generated data, the data can then be processed (symbolised by the transparent box inside the PC) by the stakeholders situated at the right side of the diagram. These include, among other, social media data analysts, OSM contributors; geographic information, land and social scientists and professionals; and the EO and AI community. The ‘content’ of the arrows pointing at the top of the mobile device will depend on the users’ needs and collaborators, and this is not discussed further here because little progress has been made in this front. This is a call for collaboration. The focus here was on the arrows pointing right, aiming to highlight the need of integrating land user-generated data in decision-making processes, and to present a highly scalable proof-of-concept for generating such data following participatory approaches and human-centred design principles.
Marcos
Collaborators: Jed Stevenson (Lead Researcher) and Dessalegn Teckle (Research Assistant-Field Officer). The community members, whose names are not disclosed. Muki Haklay. Claire Ellul, Judy Barrett, Jerome Lewis and the ExCiteS & Mapping for Change group. The Locacons and SIDERA project members, Benedikt Kamski and Will Hurd.
Acknowledgements: We want to thank the European Research Council and FORMAS for the research funding, and CARTO, the European Space Agency, Planet and Sinergise for providing free access to cloud services and satellite imagery.

would like to educate myself LourenaEngert send me the next organization day
Thanks for your comment. Happy to help. marcos.moreu@ucl.ac.uk